Agents can perform and review Evaluations with QEval.
Tabs displayed on Agent’s account:
The above mentioned tabs are based on access rights. Admin can assign separate rights to individual user.
Agent Dashboard
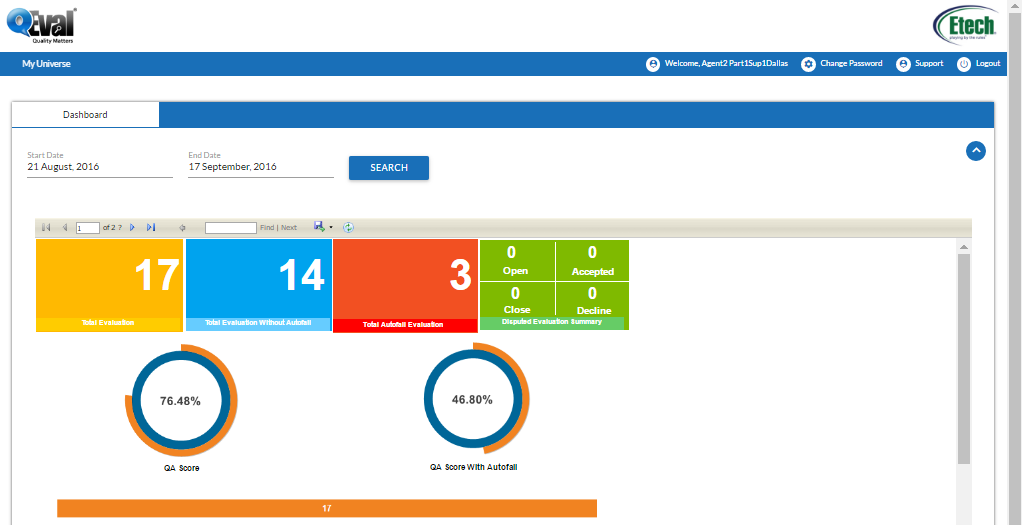
Scroll down to view more on dashboard.
Dashboard displays the Evaluations, QA score and disputes summary. The default view displays the summary of last four weeks data on the dashboard.
• To select the data for particular duration, enter the Start Date and End Date.
• Click ![]()
|
Dashboard elements |
Description |
|---|---|
|
Total Evaluation |
Displays the number of total evaluations of the agent. |
|
Total Evaluation without Autofail |
Displays the number of total evaluation without considering Autofail. |
|
Total Autofail Evaluation |
Displays total number of Autofail evaluations. |
|
Disputed Evaluation Summary |
Summarizes the total disputes. Open– Shows the Agent’s number of open disputes. Closed– Shows the Agent’s number of closed disputes. Accepted– Shows the accepted disputes. Decline– Shows the declined disputes of the Agent.
|
|
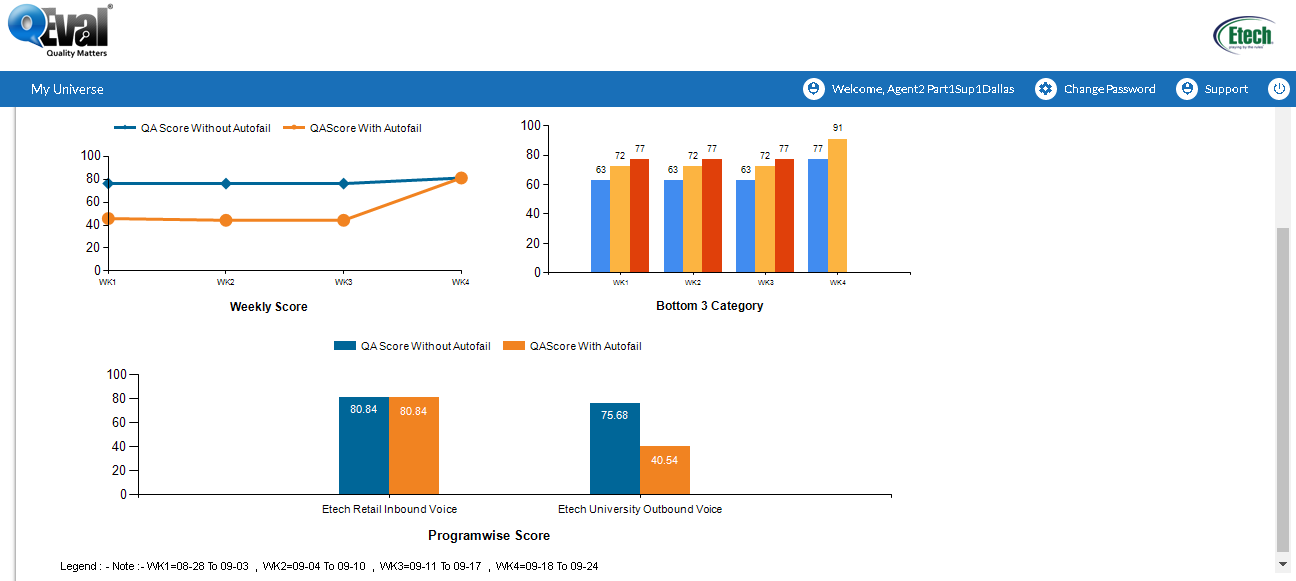
QA score |
Pie Chart– Represents the total QA score of the agent in percentage. Line graph– Represents the QA score for the selected duration (by default displays last four week data). Bar graph– Represents the comparison of all the evaluations (Total Evaluation, Total Evaluation without Autofail and Total Autofail Evaluation) for the selected duration.
|
|
QA with Autofail |
Pie Chart– Represents the total QA score of the agent in percentage. Line graph– Represents the QA score for the selected duration (by default displays last four week data). Bar graph– Represents the comparison of all the evaluations (Total Evaluation, Total Evaluation without Autofail and Total Autofail Evaluation) for the selected duration.
|
|
Programwise score |
Displays the QA score with and without Autofail of the agent for |